PROJECT OVERVIEW
Here are some famous service design articles that have been condensed into infographics for non service designers. These visualizations are an extraction of the information provided in the 30+ page articles. The visualization depict the complexities that arise when decomposing and understanding Service design methodologies.
INFOGRAPHICS
Adobe Illustrator - Adobe Photoshop - Figma - Hand Rendered

SERVICE DESIGN
INFORMATION VISUALIZATION - Visual communication is an integral part of designing. Through the use of information visualization we can condense large amounts of information and data into legible and understandable content. This can then be digested by the common non service design masses.

Socio Technical Design
Is a philosophy rather than a methodology. A study of understanding the change in humans perception towards technology and innovation. The concept of a non stop journey that evolves and changes with the humans studying it. It is often referred to as the theory of Homeostasis.
This Infographic is a condensed version of: The story of socio-technical design: Reflection on its successes, failures and potential.
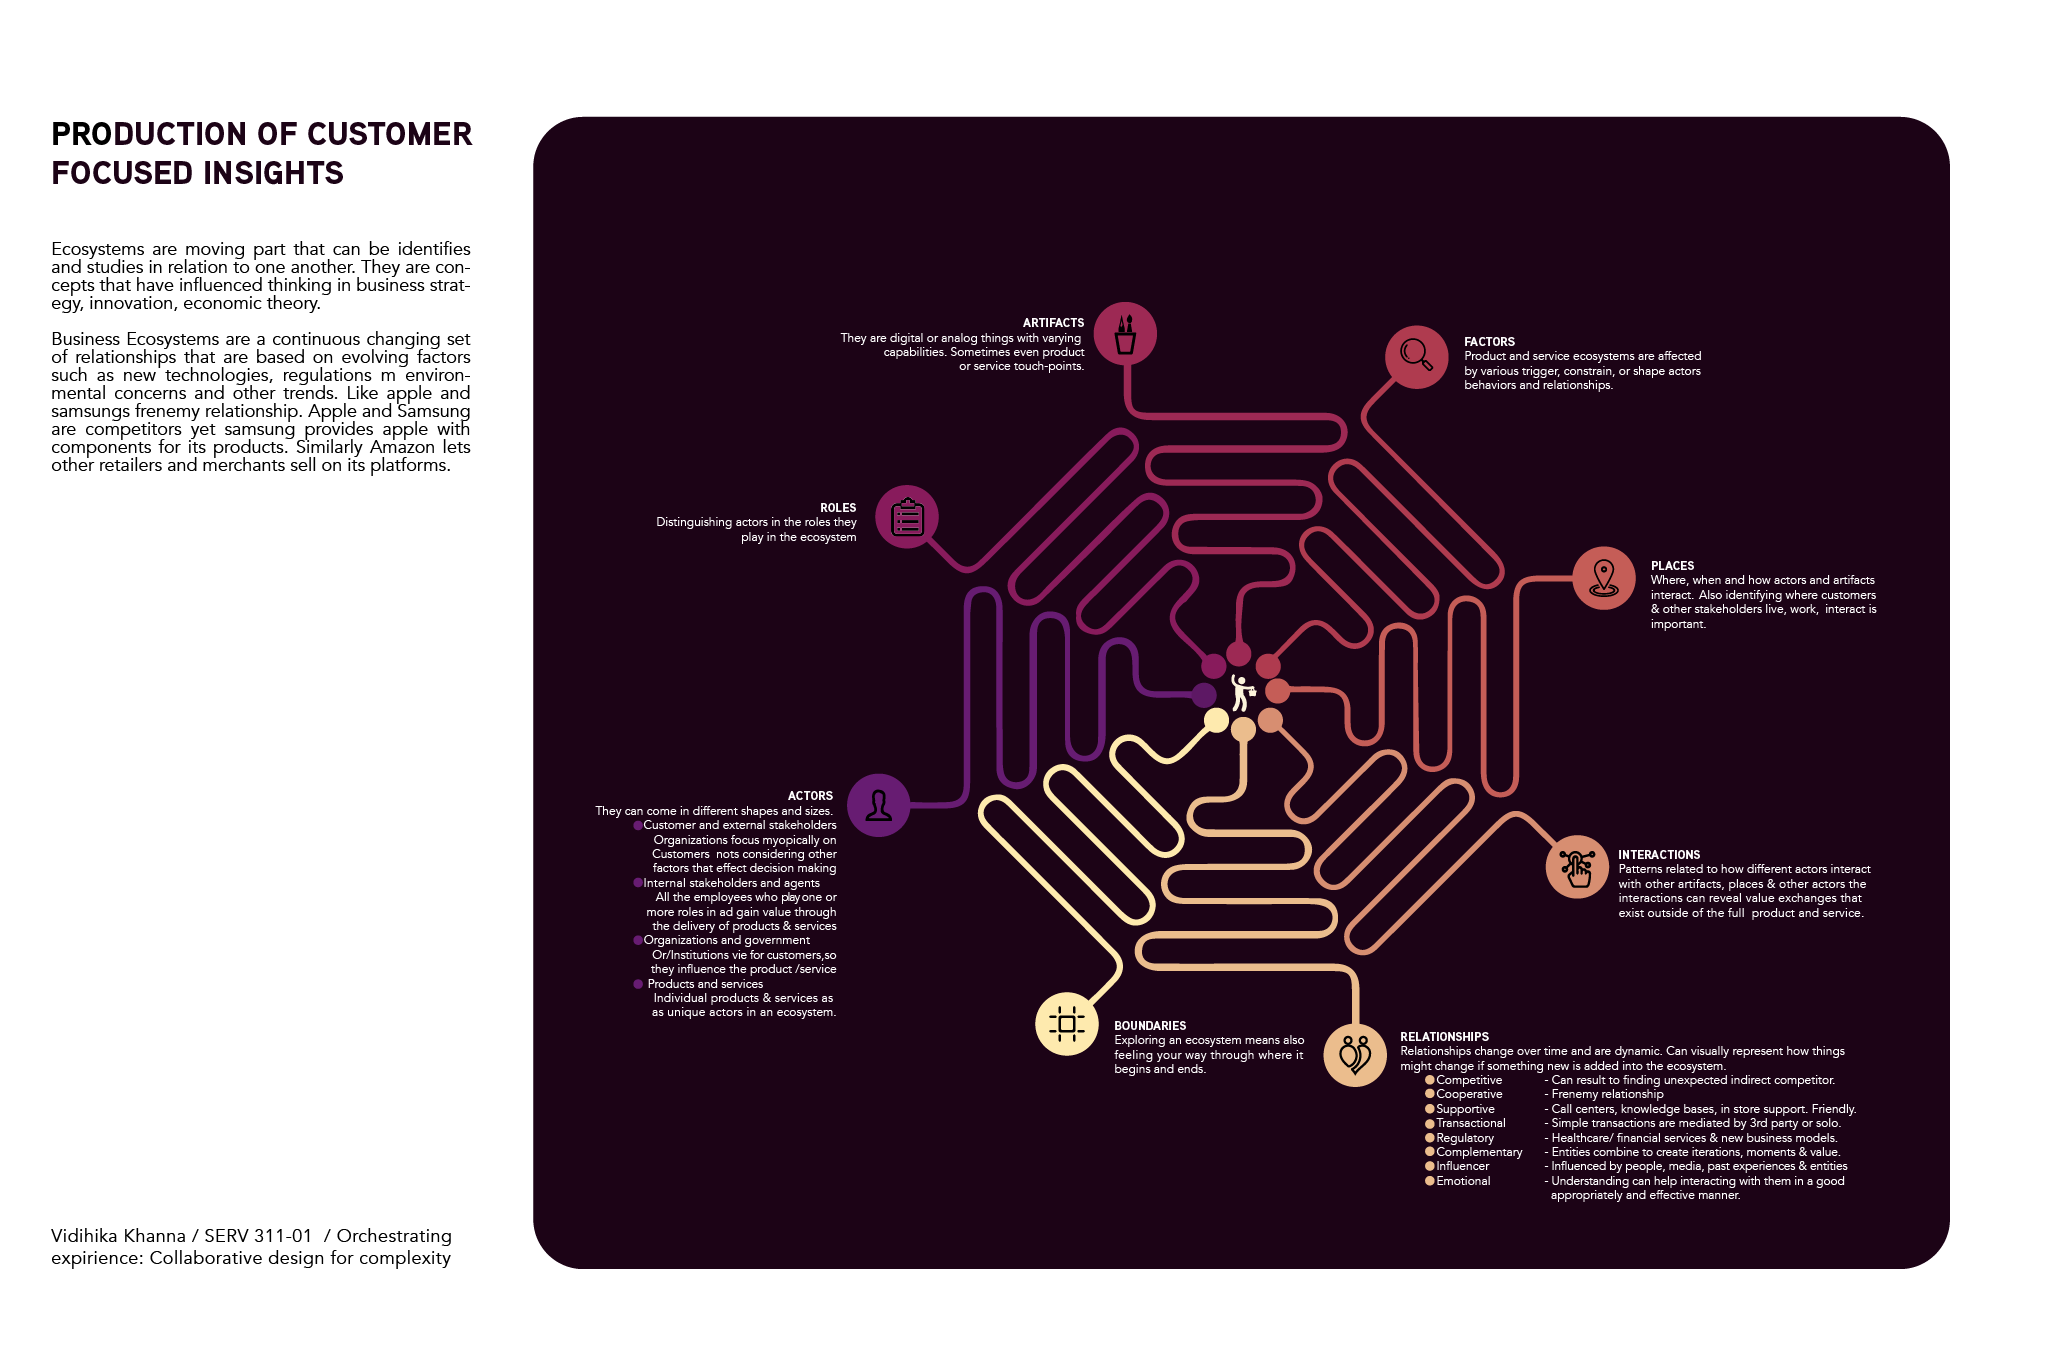
Customer Focused Insights
Ecosystems are a continuous set of relationships influenced by business strategy, innovation and economic theory.
This Infographic is a condensed version of: Orchestrating experiences: Collaborative design for complexity

Perspective Shifts
The concept of a linear designer process has recently been debunked. There are many factors that contribute to changes in process and directions. There is no linearity in the chaos.
This Infographic is a condensed version of: A systems perspective on markets — towards a research agenda