UX DESIGN- DATA VISUALIZATION
In this project, we began by understanding the main difference between data and information. Information is interpretation of the data, with respect to value, purpose, and context.
Project Overview
After the first week, we dived furthered into understanding how we, as humans, interpret data. We started to question the purpose, how it affects us, how it can be visualized and is what ways in it can be presented.

Adobe Illustrator - Adobe Photoshop - Overflow- Figma - Sketch
Situation
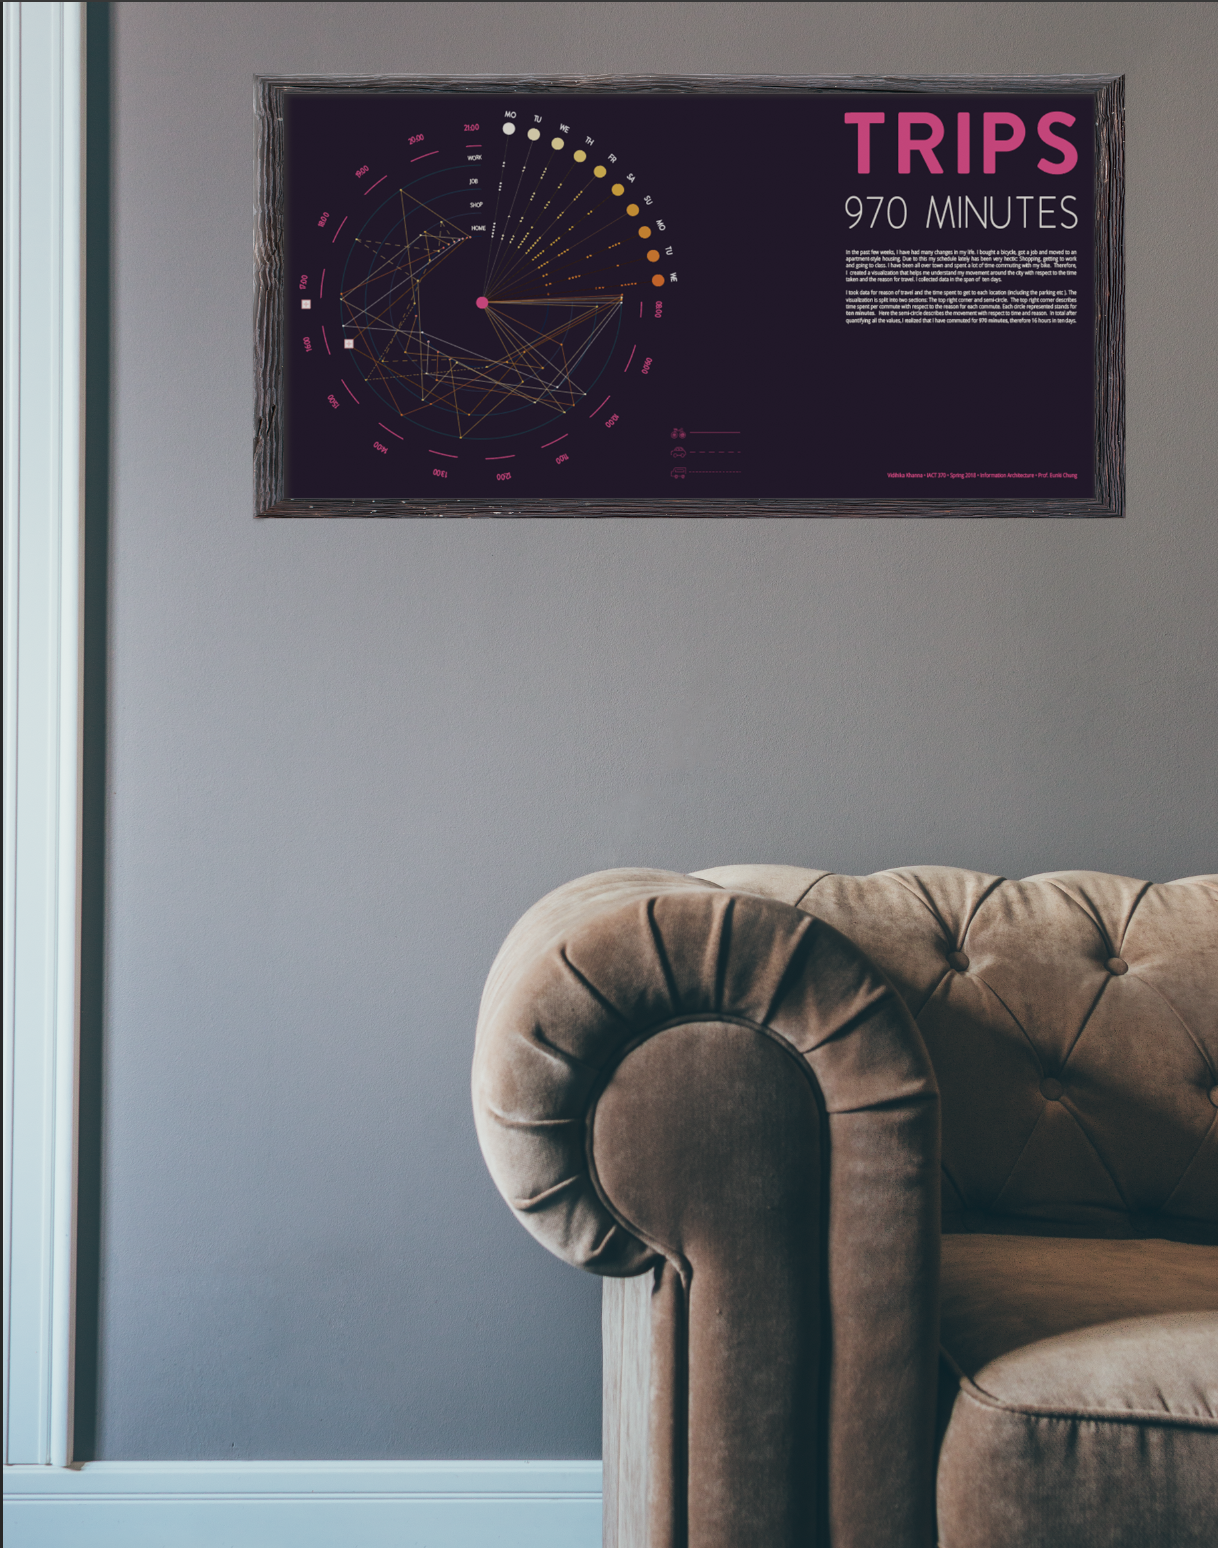
In the past few weeks, I have had many changes in my life. I bought a bicycle, got a job, and moved to an apartment-style housing. Due to this, my schedule lately has been very hectic: Shopping, getting to work attending some classes. I have been all over town and spent a lot of time commuting on my bike. What better way to understand my behavior and get to know the chaos than logging my commute.
OBJECTIVE
My initial objective was to understand where, how and at what times I moved around in the city. Taking note of what streets I took, how much time it took me, and what places I went to.
RESEARCH/ AFFINITIZATION
Data was collected based on locations travelled, time taken, mode of commute, frequency of commute and reason for commute. The visualisation helps me understand my movement around the city with respect to the time taken and the reason for travel. I collected data in the span of ten days
Breakpoint: After the fifth day of recording, I started to get discouraged and asked myself, “Do I need to go and get something printed out well beforehand? Can I just print out that sheet of paper tomorrow”. But I tried not to let it affect my habits.
SOLUTION


DOTS
The dots represents the days each trip happened and the tiny circle represent the amount of trips that happened on each day.

PIN POINTS
Each point represents a trip and the correlation between each trip and the reason conducting that trip the with respect to time
I ended up collecting more forms of data then I had presented in my final visualization. I really found it hard to really go back to my purpose and filter what I put in my final visualization. I got distracted by the various other forms of data I had collected like; locations traveled, streets crossed etc.
However, this provided to be a good learning lesson that data is meaningless and in a large amount.
It is up to us as designers to utilize it, shape it and give it meaning.